Global technology spending is projected to hit $6.37 trillion in 2026, up 14.2 percent from 2025, according to the latest forecast by Gartner. Business leaders often struggle to find reliable data because industry numbers constantly contradict each other, and a decision based on an outdated metric can mean choosing the wrong offshore region or misjudging an annual technology budget. Software Outsourcing Journal built this guide to fix that: every figure below is tied to a named, checkable source. It covers 40+ software development outsourcing statistics that matter most for buyers in 2026, spanning market growth, pricing, and vendor selection. By utilizing accurate software outsourcing statistics, you can make informed decisions.
Key Takeaways
- The global outsourcing market size reached $632.67 billion in 2026 and continues to expand rapidly. (Straits Research)
- Over 75 percent of surveyed enterprise executives outsource core IT capabilities to third-party providers. (Deloitte Insights)
- European companies continue to raise their IT sourcing budgets year over year, though the exact share varies widely by country. (Whitelane Research)
- A widely cited figure puts G2000 IT-outsourcing adoption at 92 percent, and AI-integration expectations from vendors are trending in the same direction. Keeping up with software outsourcing statistics is crucial. (DoIt Software)
Software Development Outsourcing Statistics: Key Findings
- Software spending grew 13.9 percent in 2025 and is forecast to grow 15.5 percent in 2026. These software development stats highlight strong enterprise demand. (Gartner)
- Cost reduction remains a primary driver for 57 percent of executives worldwide. (Deloitte Insights)
- Global enterprise surveys show software development and custom application building remain top delegated IT functions across enterprise buyers. (Deloitte Insights)
- About 81 percent of buyers want their external providers to act as strategic collaborators. (DoIt Software)
- Security is consistently ranked as the top IT investment priority for European enterprises in Whitelane’s sourcing studies. (Whitelane Research)
Market Size and Growth Statistics
Global Market Value and Forecast
The financial footprint of the external tech industry is massive. Analysts value the global software development outsourcing market size at $632.67 billion in 2026 (Straits Research). The market is projected to reach $815.24 billion by 2034. Furthermore, worldwide software spending is projected to reach $1.468 trillion in 2026 (Gartner). Tracking the software outsourcing market size helps define the global software outsourcing market trajectory.
Growth by Region
Growth rates vary significantly depending on geographic location. The Asia Pacific region holds the largest market share at 38.4 percent. Meanwhile, North America represents the fastest-growing regional market with a projected CAGR of 9.74 percent through 2034 (Straits Research). Reviewing these software outsourcing stats ensures businesses target the right locations.
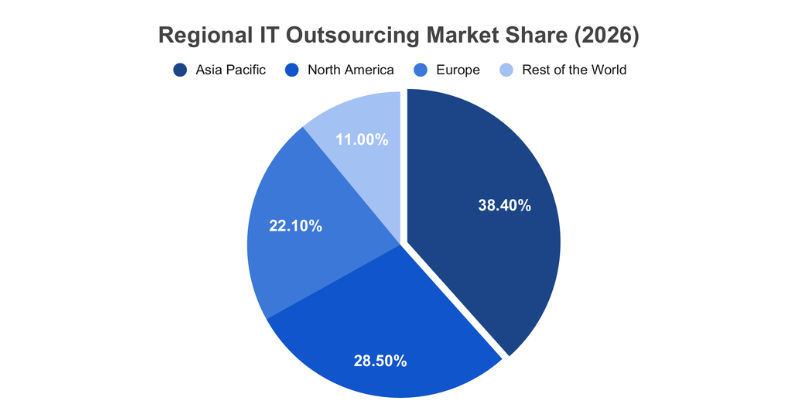
Source: IT Outsourcing Market Size, Share, Trends & Growth Graph by 2033 (Straits Research)
What This Means for Buyers
The steady expansion of the software outsourcing statistics indicates that external tech partnerships are essential business strategies rather than temporary cost-cutting measures. High demand in regions like Asia Pacific creates stiff competition for senior engineering talent, making early contract commitments critical for buyers.
Adoption Statistics by Company Size
Organizations leverage external tech talent differently depending on their internal scale. Evaluating stats about outsourcing clarifies how competitors operate.
Enterprise Adoption Rates
Large corporations dominate global offshore engagements, and their budgets show it: 57 percent of Global 2000 companies rely heavily on global talent pools (DoIt Software). The software development outsourcing services market enables rapid enterprise scaling.
SME and Startup Adoption Rates
Small and medium-sized businesses utilize offshore engineering to launch digital products without incurring high domestic overhead. A recent small business survey found that 83 percent of small businesses planned to maintain or increase their outsourcing spending (MicroSourcing). Understanding offshore software development statistics is vital for SME budgeting.
What This Means for Buyers
Growing firms do not require massive capital reserves to build high-quality software products. Tapping into global talent pools enables startups to extend cash runways while scaling technical capacity dynamically.
Why Companies Outsource: Motivation Statistics
Understanding core business drivers helps enterprise leadership align external partnerships with broader strategic goals. These stats on outsourcing indicate a major shift.
Cost Savings vs. Talent Access
Accessing specialized technical talent has officially surpassed raw labor cost reduction as the primary driver for external hiring. Whitelane’s European sourcing studies have found access to talent and resources overtaking scalability as the leading outsourcing driver in recent years. (Whitelane Research)
What Changed Since 2024
The strategic focus of enterprise buyer contracts has shifted over time. Cost reduction, once the dominant driver, has been losing ground to talent access and agility in Deloitte’s most recent surveys (Deloitte Insights). Besides, different secondary sources report different current figures for this shift, so treat any single precise percentage here with caution.
What This Means for Buyers
Selecting tech partners based solely on low hourly rates creates operational risk. The primary advantage of modern outsourcing is securing niche engineering skills and rapid scaling capabilities that local hiring markets cannot supply.
Software Outsourcing Rates and Cost Statistics
Pricing structures vary significantly across geographic engineering hubs. Evaluating IT outsourcing stats ensures accurate financial benchmarking.
Hourly Rates by Region
Software engineering rates reflect local cost-of-living indices and developer talent density. According to Accelerance’s 2026 rates analysis, Eastern Europe ranges between $31–$39/hr for junior talent to $64–$76/hr for senior engineers, while Latin America ranges between $33–$45/hr for junior talent up to $60–$75/hr for senior developers. Asia Pacific rates remain the most cost-effective globally, dropping approximately 8% compared to 2025 levels. (Accelerance)
| Region | Junior Developer | Mid-Level Developer | Senior Developer |
|---|---|---|---|
| North America | $55 – $80 | $80 – $120 | $120 – $170 |
| Western Europe | $45 – $60 | $65 – $90 | $95 – $130 |
| Eastern Europe | $31 – $39 | $40 – $63 | $64 – $76 |
| Latin America | $33 – $45 | $46 – $59 | $60 – $75 |
| Asia Pacific | $18 – $32 | $32 – $46 | $46 – $68 |
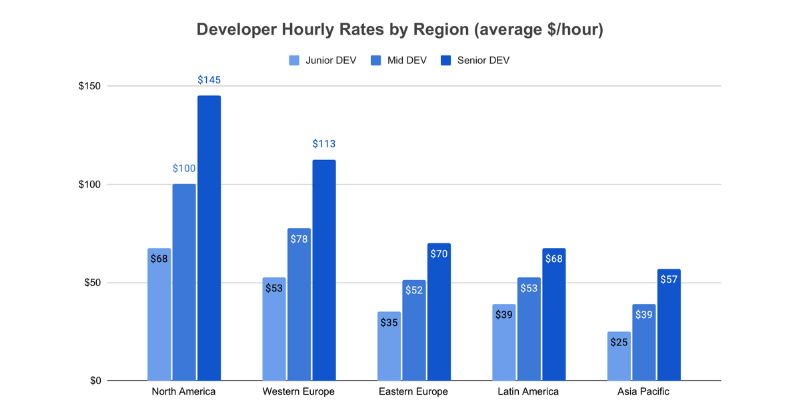
Source: 2026 Outsourcing Rates: Global Costs Are Trending Down (Accelerance)
Hourly Rates by Role
Technical specializations command distinct rate premiums based on market complexity. Industry estimates compiled across recent market benchmarks show specialized DevOps Engineers command global rates averaging $45 to $110 per hour, while Cloud Architects average $65 to $130 per hour. Mobile application and general software developers typically range from $60 to $120 per hour globally, and Quality Assurance (QA) specialists average between $20 and $40 per hour depending on the region (Arc.dev, Index.dev). Specific specialized backend architecture roles can range from $20 to $150+/hr depending on region (AAlpha).
To help technical founders, CTOs, and hiring managers budget effectively, we have standardized the data to calculate the blended global average hourly rates for key software development roles.
Here are the official survey results from the Software Outsourcing Journal:
2026 Global Developer Rate Survey:
| Role / Specialization | Blended Average Hourly Rate (USD) |
|---|---|
| Backend Developer | $45 – $145 |
| Frontend Developer | $35 – $120 |
| Full-Stack Developer | $70 – $160 |
| Mobile Application Developer | $35 – $85 |
| DevOps & Cloud Engineer | $50 – $115 |
| Quality Assurance (QA) Specialist | $25 – $50 |
| AI / Machine Learning Engineer | $100 – $250+ |
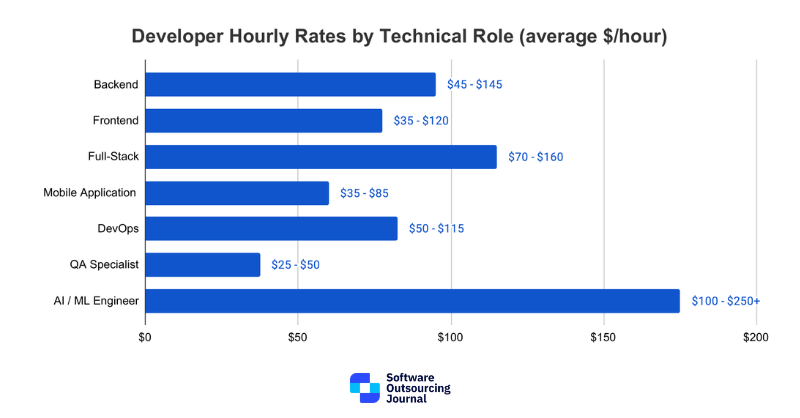
Source: Global Tech Talent Rate Benchmark from Software Outsourcing Journal
What This Means for Buyers
Blended rate models, pairing an onshore or nearshore senior architect with offshore mid-level engineers, tend to deliver the best financial value: buyers get senior-level oversight without paying senior-level rates across the whole team.
Vendor Landscape Statistics
Understanding the ecosystem of service providers requires analyzing outsourcing software development statistics to locate the right partner scale and market trajectory.
Global IT Services Market Trajectory
The global IT services outsourcing market is experiencing massive revenue expansion. According to market analysis, the industry was valued at $797.4 billion in 2025 and is projected to reach $1,498.2 billion by 2033, growing at a compound annual growth rate (CAGR) of 8.3 percent. (Grand View Research)
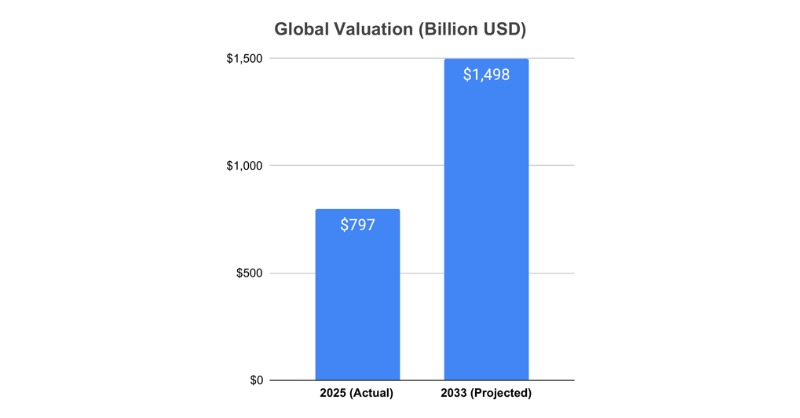
Source: IT Services Outsourcing Market (2026 – 2033) (Grand View Research)
Baseline Project Cost Benchmarks
Rather than evaluating minimum contract thresholds, enterprise buyers should benchmark against global project delivery costs. According to recent software development pricing benchmarks from Aionys, building a simple Minimum Viable Product (MVP) requires a baseline budget between $20,000 and $75,000. Mid-complexity platforms for SMEs, such as those requiring custom business logic and CRM/ERP integrations, typically cost between $75,000 and $300,000. Meanwhile, complex enterprise builds (e.g., core ERPs or financial software) scale from $500,000 to well over $2,000,000 depending on architecture, security, and integration scope.
What This Means for Buyers
Understanding realistic baseline costs prevents severe undercapitalization. Buyers expecting to build mid-level business applications for under $,000 are highly likely to experience budget overruns, delayed timelines, or compromised architectural integrity.
AI Impact Statistics
Artificial intelligence is fundamentally reshaping software engineering, setting new benchmarks for speed and efficiency. Today, the top artificial intelligence development companies embed generative AI across the entire development lifecycle to maximize client value. Understanding these metrics helps buyers accurately evaluate vendor capabilities and negotiate smarter contracts.
AI Adoption Among Vendors
An overwhelming 83 percent of global IT service providers leverage artificial intelligence tools in client project delivery (Deloitte Insights). Examining AI in software development statistics reveals that tech buyers heavily expect vendor engineering teams to actively utilize AI coding assistants.
Reported Productivity Gains
Engineering vendors self-report developer productivity gains between 20 and 30 percent after integrating AI coding assistants. Providers also report a 25 percent reduction in code testing and debugging cycles. (McKinsey & Company)
What This Means for Buyers
Buyers should structure outcome-based contracts that capture vendor AI efficiency gains. Ensure contracts mandate full code security transparency and clear intellectual property protocols when AI tools are utilized.
Success and Failure Rate Statistics
Navigating external software engagements requires a clear understanding of common outsourcing risks and failure metrics. Analyzing these statistics enables buyers to implement proactive governance, helping them avoid widespread budget overruns and safeguard their technology investments.
Project Success and Failure Rates
Recent data from McKinsey reveals the sheer complexity of external engagements: on average, IT projects exceed their budgets by 75 percent and overrun their schedules by 46 percent. Understanding software development project failure statistics is critical, as McKinsey notes that 17 percent of IT projects perform so poorly that they threaten the very existence of the company. (McKinsey & Company)
Top Reasons Engagements Fail
- Scope Creep & Misaligned Requirements: One of the most commonly cited causes of delivery failure, per PMI’s own research on the topic. (PMI)
- Communication & Time-Zone Friction: A frequent secondary cause, especially in distributed and offshore team structures (PMI).
What This Means for Buyers
Establishing precise deliverable milestones and structured code review cadences significantly reduces delivery failure risks.
Engagement Model Statistics
Selecting the right collaboration framework is crucial for balancing operational agility, cost management, and long-term project success. As businesses scale, understanding the various software outsourcing models helps tech leaders align vendor capabilities with their specific development needs.
Staff Augmentation & Dedicated Teams vs. Project-Based Split
According to Deloitte, enterprise buying preferences have shifted dramatically toward flexible, capacity-based models (such as Staff Augmentation and Dedicated Teams), with 87 percent of organizations considering external third-party workers an essential part of their workforce strategy to access specialized talent and operational agility. Conversely, traditional fixed-price project contracts represent a shrinking share, best reserved for isolated initiatives with highly defined, unchanging specifications. (Global Outsourcing Survey 2024)
Shift Toward Hybrid Teams
Approximately 40 percent of enterprise buyers plan to expand their reliance on hybrid delivery models. This drives the importance of nearshore software development statistics, balancing real-time collaboration with cost efficiency. (Whitelane Research)
What This Means for Buyers
Staff augmentation offers maximal operational flexibility for evolving product roadmaps. Fixed-price contracts remain best suited for isolated, fully defined technical specifications. Buyers can better evaluate the differences between staff augmentation, dedicated team, and hybrid models to determine which engagement structure best fits their project requirements.
Buyer Behavior Statistics
Understanding vendor selection behaviors provides critical benchmarks for structuring an efficient procurement process. By analyzing decision-making patterns, organizations can streamline vendor evaluation, reduce administrative friction, and accelerate project kickoffs.
How Long Vendor Selection Takes
Vendor selection is rarely fast. According to proprietary research by the Software Outsourcing Journal, mid-market companies take an average of 4 to 6 weeks to evaluate providers, while enterprise organizations typically require 8 to 12 weeks due to multi-layered compliance reviews, security audits, and multi-stakeholder approvals.
What Buyers Evaluate First
- Verified Case Studies & Past Portfolios (68%): Cited by the Software Outsourcing Journal as the primary filter buyers used to validate real-world technical execution before initiating contact.
- Domain Expertise & Industry Compliance (22%): Evaluated second to ensure team readiness for complex regulatory environments (e.g., HIPAA, SOC 2, GDPR).
- Hourly Rate Transparency & Contract Flexibility (10%): Serves as the final decision factor when shortlisting compatible engineering partners.
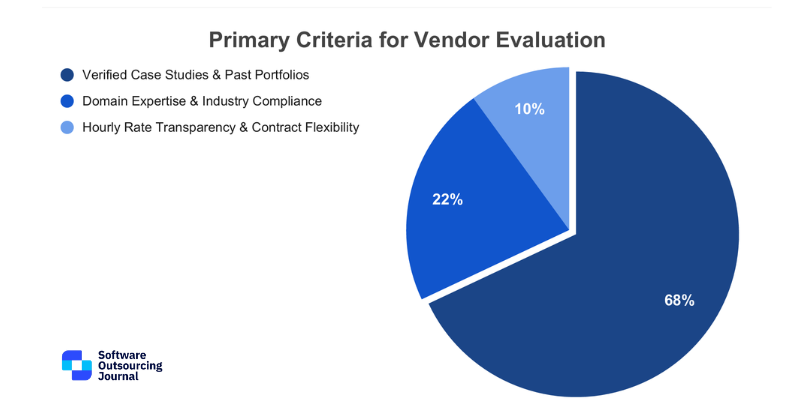
Source: Software Outsourcing Journal Proprietary Research
What This Means for Buyers
Leading with verified case studies and reference checks, rather than rate cards, tends to shorten the overall procurement cycle.
Outsourcing Destination Statistics
Evaluating global talent pools is essential for building scalable, high-performing engineering teams across nearshore and offshore locations. By leveraging regional strengths in technical education, market capacity, and time-zone alignment, buyers can strategically optimize both cost and collaboration efficiency.
Asia Pacific and Eastern Europe
Recent 2025 and 2026 industry analyses highlight the sheer scale of talent in these regions: India produces between 1.05 million and 1.5 million engineering graduates annually. (Business Standard)
Latin America and Emerging Markets
Latin America is a premier nearshore destination for North American enterprises, offering real-time time-zone overlap. Brazil alone accounts for over 500,000 software developers. (Mordor Intelligence)
| Destination Region | Key Strength | Average Hourly Rate | Primary Advantage |
|---|---|---|---|
| Asia Pacific | High talent volume & cost efficiency | $25 – $50 | Scalability for large projects |
| Eastern Europe | Strong technical STEM background | $40 – $75 | Complex engineering capabilities |
| Latin America | Direct time-zone alignment with US | $35 – $65 | Real-time daily collaboration |
Source: Compiled from Software Outsourcing Journal Proprietary Market Research.
What This Means for Buyers
Match offshore locations to internal team workflows. Nearshore destinations excel at daily agile collaboration, while offshore regions offer unmatched capacity scaling.
Software Outsourcing Outlook Through 2030
- Commoditization of Standard Code: Basic software development tasks will experience downward price pressure as AI coding assistants mature.
- Value-Based Contracting: Vendor contracts will shift from hourly billing models toward outcome-based service level agreements (SLAs) tied to deployment velocity.
- Multi-Region Diversification: Enterprises will increasingly spread engineering footprints across multiple geographic hubs to hedge against geopolitical and operational risks.
How Software Outsourcing Journal Tracks Vendor Data
Software Outsourcing Journal operates an independent evaluation directory connecting enterprise buyers with verified engineering providers. Our platform collects anonymized performance metrics, verified client reviews, and delivery capabilities to maintain complete transparency across the IT services ecosystem.
FAQs
How big is the software development outsourcing market in 2026?
The global IT and software outsourcing market is valued at $632.67 billion in 2026 and is projected to expand to $815.24 billion by 2034 (Straits Research). Additionally, overall global IT service market valuations reach $1,498.2 billion by 2033. (Grand View Research)
What percentage of companies outsource software development?
Over 75 percent of enterprise executives outsource core IT capabilities, with 80 percent planning to maintain or expand their third-party vendor investments (Deloitte Insights). Furthermore, 57 percent of Global 2000 enterprises rely heavily on external software engineering teams. (DoIt Software)
How much does outsourcing software development cost per hour?
Hourly developer rates range from $18–$68 in Asia Pacific up to $55–$170 in North America, depending on developer seniority.
What is the failure rate of outsourced software projects?
According to McKinsey, while catastrophic failure hits roughly 17 percent of IT projects, a staggering 46 percent experience schedule overruns, and 75 percent exceed their initial budgets. (McKinsey & Company)
Which country is the largest offshore development destination?
India represents the largest offshore talent supplier, generating 1.05 million to 1.5 million engineering graduates annually (Business Standard), while Vietnam accelerates its software workforce expansion, injecting 57,000 to 70,000 specialized IT graduates into the market each year. (VnEconomy)
Is software outsourcing growing or declining?
The market is expanding rapidly, with North America projecting a 9.74 percent CAGR through 2034 (Straits Research). Growth is no longer driven by cost savings alone. Talent access, AI adoption, and flexible engagement models are the software outsourcing trends now shaping buyer decisions through 2030.
How is AI changing software outsourcing costs?
AI tools increase engineering productivity by 20 to 30 percent, driving a transition toward productivity-linked, value-based pricing models. (McKinsey & Company)
Conclusion
Navigating the global market requires verified market intelligence. By understanding current rate structures, regional strengths, and AI productivity impacts, enterprise leaders can build resilient engineering partnerships. Reliable software development outsourcing statistics act as the foundation for these strategic choices, accelerating digital innovation safely.
References
- Gartner. “Gartner Forecasts Worldwide IT Spending to Grow 14.2% in 2026, Totaling $6.37 Trillion.” July, 2026.
- Straits Research. “IT Outsourcing Market Size, Share, Trends & Growth Graph by 2033.” September, 2026
- Deloitte. “Global outsourcing survey 2022.” 2022
- Whitelane Research. “Annual Research Studies.”
- DoIt Software. “Outsourcing Statistics in 2026: Key Trends & Forecasts.” July, 2026
- MicroSourcing. “The Ultimate List of Outsourcing Statistics for 2025.” May, 2026
- Accelerance. “2026 Outsourcing Rates: Global Costs Are Trending Down.” November, 2025
- Arc.dev. “Freelance Developer Rate Explorer.”
- Index.dev. “Freelance Software Developer Rates by Country in 2026.”
- AAlpha. “Backend Developer Hourly Rate: A Complete Pricing Guide.”
- Grand View Research. “IT Services Outsourcing Market (2026 – 2033).” September, 2026
- Aionys. “Custom Software Development Cost in 2026: Rates, Project Types, and Cost Reduction Strategies.” August, 2026
- McKinsey & Company. “Unleashing developer productivity with generative AI.” June, 2023
- McKinsey & Company. “Unlocking the potential of public-sector IT projects.” July, 2022
- PMI. “Boosting Business Acumen.”
- Deloitte. “Global Outsourcing Survey 2024.” 2024
- Whitelane Research. “2026 Nordic IT Sourcing Study.” 2026
- Business Standard. “Only 10% of India’s 1.5 mn Engineering Graduates to Secure Jobs This Year.” September, 2024
- Mordor Intelligence. “South America IT Services Market Size & Growth Report 2030.”
- VnEconomy. “Vietnam’s AI Ambitions Face Talent Shortage Amidst Booming Tech Sector.” September, 2025